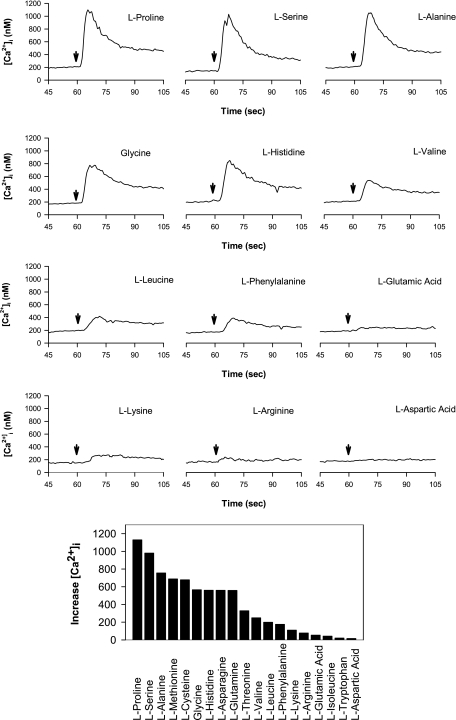
Fig. 4.
Top: effect of addition of different l-amino acids on [Ca2+]i in STC-1 cells. Time of addition is marked by downward arrow. In each case, the final amino acid concentration was 5 mM, and the [Ca2+]e was 1.8 mM. Bottom: average increase in [Ca2+]i in response to 19 different amino acids, each at 5 mM. Responses from 2 separate slides for each amino acid were averaged together.

