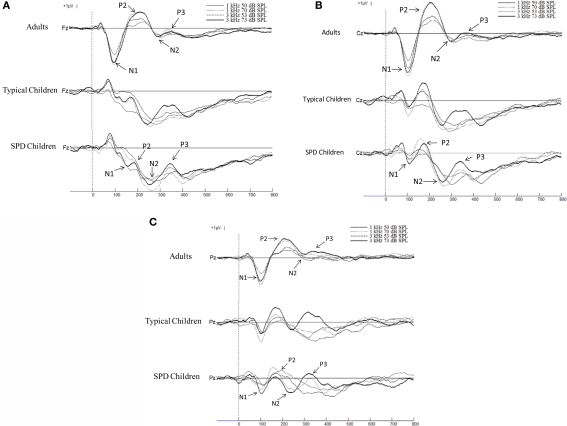
Figure 1.
(A) Grand averages of the ERPs at Fz with 100-ms baseline prior to the stimulus filtered with a bandpass of 0. 23–30 Hz. The thin line represents the auditory stimulus presented at 1 kHz 50 dB SPL, the dotted line represents the1 kHz 70 dB SPL stimulus, the dashed line represents the 3 kHz 53 dB SPL stimulus, the thick line represents the 3 kHz 73 dB SPL stimulus. Positive voltage is up. (B) Grand averages of the ERPs at Cz with 100-ms baseline prior to the stimulus filtered with a bandpass of 0.23–30 Hz. The thin line represents the auditory stimulus presented at 1 kHz 50 dB SPL, the dotted line represents the1 kHz 70 dB SPL stimulus, the dashed line represents the 3 kHz 53 dB SPL stimulus, the thick line represents the 3 kHz 73 dB SPL stimulus. Positive voltage is up. (C) Grand averages of the ERPs at Pz with 100-ms baseline prior to the stimulus filtered with a bandpass of 0.23–30 Hz. The thin line represents the auditory stimulus presented at 1 kHz 50 dB SPL, the dotted line represents the1 kHz 70 dB SPL stimulus, the dashed line represents the 3 kHz 53 dB SPL stimulus, the thick line represents the 3 kHz 73 dB SPL stimulus. Positive voltage is up.

