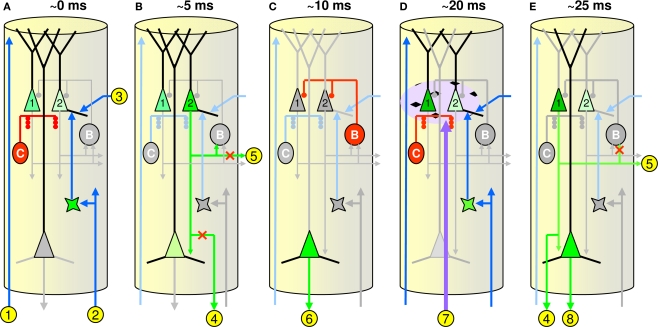
Figure 5.
Hypothetical minicolumnar circuit. (A–E) Depict critical events transpiring in a single minicolumn at five points in time during the CSA's computational cycle, which I propose corresponds to one gamma cycle: approximate timings relative to start of CSA cycle are shown across top. The units labeled “C” (“B”) represent the local chandelier (basket cell) populations, respectively; See text for detailed explanation.

