
FIG. 5.
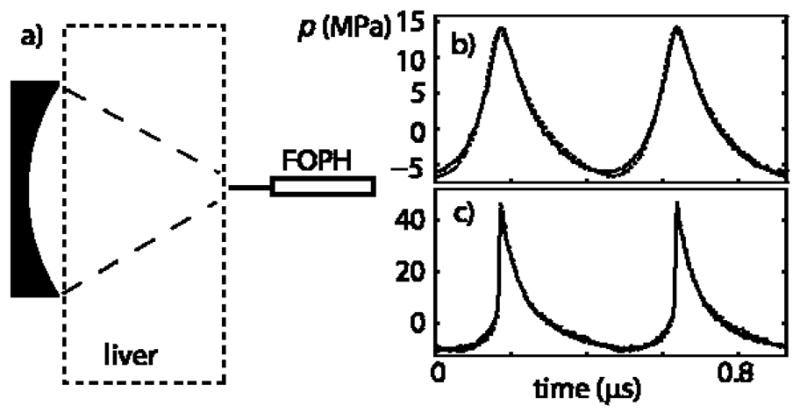
(a) Diagram of the experimental arrangement for measurement of focal waveforms in ex vivo bovine liver. (b) Focal waveform measured in water at p0 = 0.18 MPa (dashed line) compared with the focal waveform measured after propagation through a 27-mm thick sample at p0 = 0.3 MPa (solid line). By matching experimental focal waveforms obtained in water and behind the liver sample, the attenuation of liver was determined as 1.6 dB/cm at 2.158 MHz. (c) Focal waveform measured in water at p0 = 0.36 MPa (dashed line) compared with the focal waveform measured behind the liver sample at p0 = 0.57 MPa (solid line). The initial pressure in tissue was chosen using the absorption coefficient α and the proposed soure pressure scaling approach, Eq. (3).