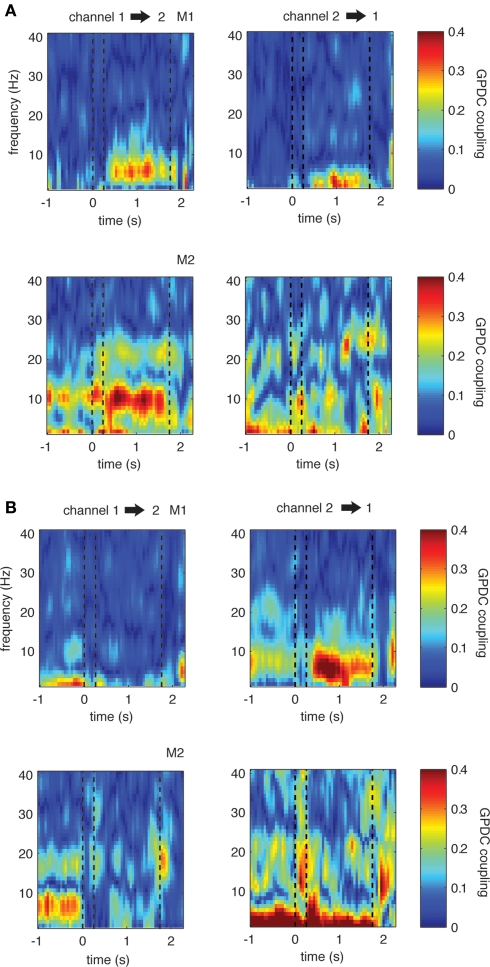
Figure 5.
Single example LFP channel pairs showing significant changes in coupling during the delay period compared to baseline. (A) One example for each monkey in which there is significant increase in coupling in the direction from channel 1 to 2 (left). (B) Two examples in which there is significant decrease in theta in one direction (left). The opposite directions show less strong or even opposing trends, indicating that coupling is not symmetric between sites. Dashed lines represent the on- and offset of the sample stimulus, as well as the onset of the first test stimulus during the trials, from left to right, respectively. This convention is also used in the subsequent figures.

