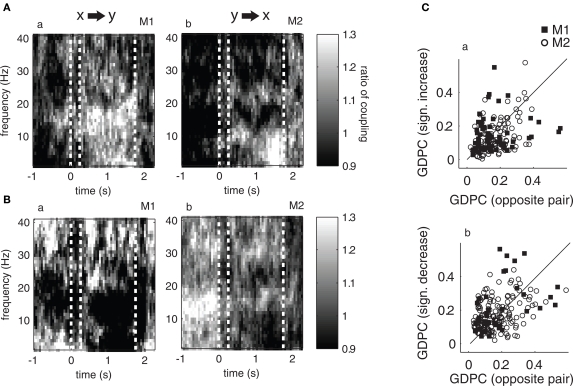
Figure 7.
Ratio of median coupling between pairs showing significantly enhanced (A) and reduced (B) directed coupling during baseline and their opposite pairs (i. e., coupling in opposite direction). Plots a–b show the ratio of median coupling across the time course of the trial for different frequencies for monkey 1 and 2, respectively. A ratio larger (or smaller) than one indicates a stronger median coupling in one than the opposite direction, thus the ratio is an indicator of how “directed” or “symmetric” the coupling is between pairs of channels. Graphs (C) plot the degree of coupling of significant pairs and their opposite directions (y-axis pairs chosen based on sign difference between delay and baseline, x-axis shows opposite direction) in the theta band. If the degree of coupling is not symmetric between directions, data points deviate from the diagonal. Also note that if there was a significant increase (decrease, respectively) in both directions for a single pair, two data points are shown (one below, one above the diagonal if the respective increase/decrease is not fully symmetric).

