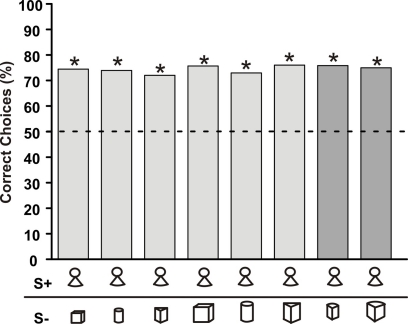
Figure 2.
Choice frequency for S+ of a G. petersii trained to discriminate between a fixed S+ (‘little man’) and six differently shaped objects. Light grey bars represent choice frequency when known S− objects were used, while dark grey bars depict the choice frequency when previously unknown objects were paired with the S+. The symbols below each bar indicate the object combinations (Table 1) used (n > 264 for each combination, asterisks indicate significant choice on the 5% level as evaluated using the Chi-square test). Here and in the subsequent figures, choice frequency for S+ was determined in non-rewarded and non-punished test trials.

