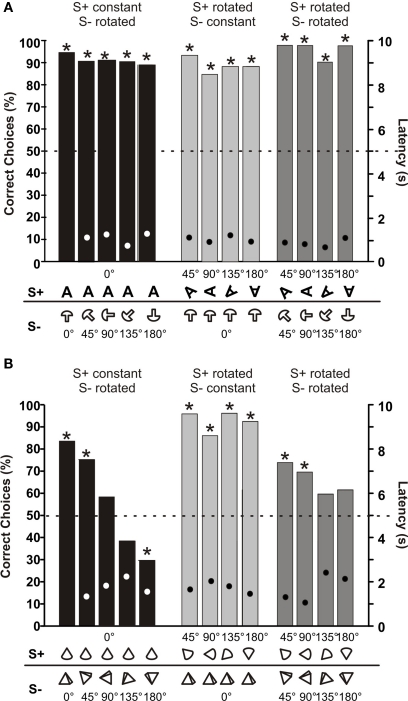
Figure 6.
(A) Mean choice frequencies of fish 4, which was trained to discriminate between a 3-dimensional A (S+) and a mushroom (S−), symbols of which showing the rotation angle are given below each bar along the abscissa. Both objects were rotated by various angles (numbers above symbols). (B) Mean choice frequencies with rotated objects of fish 5, which was trained to discriminate between a cone (S+) and a pyramid (S−). Dots within each column give mean choice latencies (right ordinate). N ≥ 50.

