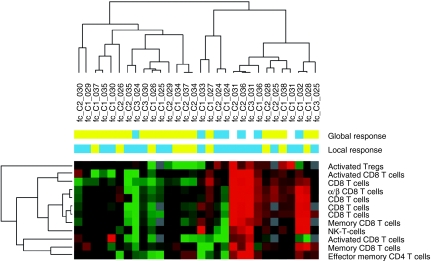
Figure 1.
Classification of patient samples using immune cellular markers predicting clinical response to TG1042. The heat map was obtained by unsupervised hierarchical clustering of 30 conditions (fold-change differences in marker expression between the end of treatment cycle and baseline) and using 12 predictor immune cellular markers. The similarity of gene expression profiles among experimental samples is summarized in a dendrogram above the heat map, in which the pattern and the length of the branches reflect the relatedness of the conditions. Red in the heat map stands for high relative level of expression; green for low relative level of expression. Objective clinical response either local or global is represented by blue squares, whereas lack of objective response is represented by yellow squares.

