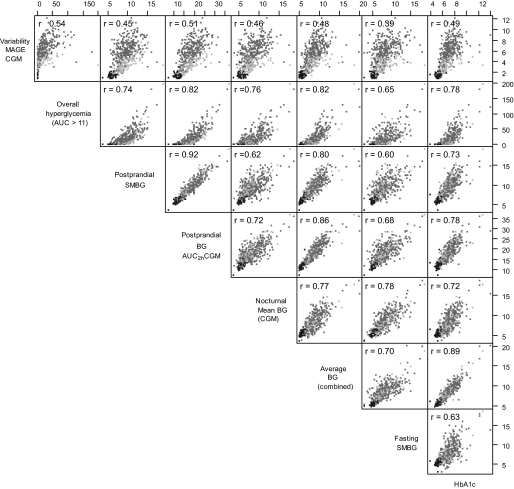
FIG. 1.
Pairwise scatter diagrams illustrating selected correlations of glycemic variables with Pearson correlation coefficients (r) for each pair of indexes (not including data for no diabetes), highlighting the different participant subgroups with different shades (type 1 diabetes, dark gray; type 2 diabetes, light gray; and no diabetes, black).

