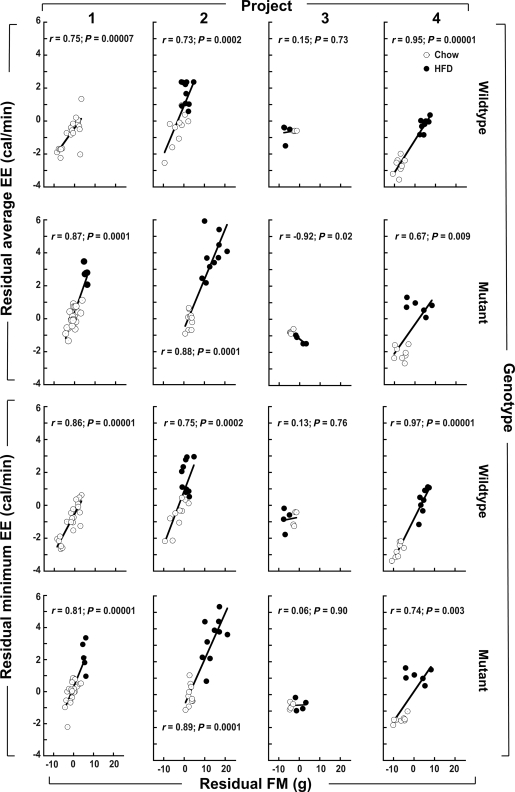
FIG. 2.
Relationship between EE and FM residuals (the components of EE and FM that are not explained by LBM) within eight subgroups defined by project number and genotype. ○, Chow-fed mice; ■, HFD-fed mice. The top two rows show the relationship between average EE and FM residuals depicted in Fig. 1F stratified by project and genotype, and the bottom two rows do likewise for the minimum EE and FM residuals depicted in Fig. 1L. The LBM-adjusted EE versus LBM-adjusted FM associations are positive and significant in all subgroups except for those involving project 3, which entailed small sample sizes (n = 8 chow, n = 8 HFD). Multiple regression models for EE as a function of LBM, FM, sex, diet, activity, and membership in each subgroup defined by project and genotype revealed that FM is a quantitatively important and highly significant determinant of murine EE (see text). Interpretation: FM is strongly associated with EE, even after controlling for the relationship between each of these traits and LBM.

