FIG. 4.
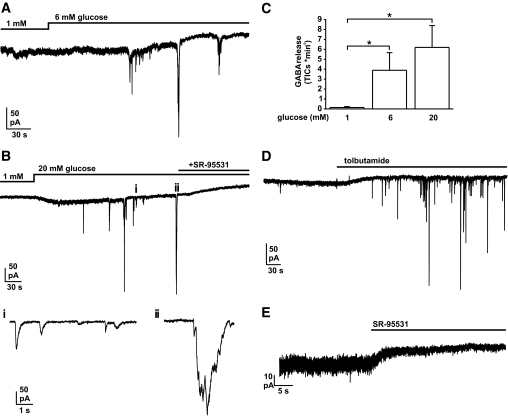
Glucose- and tolbutamide-induced GABA release from human β-cells. Experiments were performed in small clusters of islet cells overexpressing α1/β1 GABAAR. The patch-clamped cell was held at −70 mV and infused with pipette solution containing 10 mmol/l EGTA. A: The glucose concentration in the bath was increased from 1 to 6 mmol/l as indicated. B (upper): The extracellular glucose concentration was increased from 1 to 20 mmol/l. SR-95531 (10 μmol/l) was included as indicated. B (lower): Sections of top trace (as indicated by letters i and ii) shown on an expanded time base. C: Summary of observed frequencies of GABA release (TICs/min) at the indicated glucose concentrations (*P < 0.05). The measurements were made at steady state (1–5 min after addition of glucose). D: Tolbutamide (100 μmol/l) was applied as indicated (extracellular glucose concentration 4 mmol/l). E: SR-95531 (10 μmol/l) was applied as indicated at 1 mmol/l extracellular glucose.

