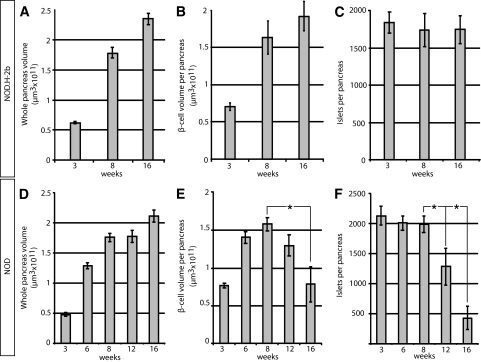
FIG. 3.
A and D: Graphs showing the average whole-pancreas volume (duodenal and splenic) at 3, 8, and 16 weeks and in NOD.H-2b mice (A) and in NOD mice (D) at 3, 6, 8, 12, and 16 weeks. B and E: Average total pancreatic β-cell volume in NOD.H2-b (B) and NOD (E) mice. C and F: Average islet number in NOD.H2-b (C) and NOD (F) mice. n = 5 for NOD at 3, 6, 8, and 16 weeks, n = 4 for NOD at 12 weeks, and n = 3 for NOD.H-2b at 3, 8, and 16 weeks. Values are given ± SE. Significance levels for the decay of β-cell volume and number of islets are indicated. *P < 0.05; **P < 0.01.

