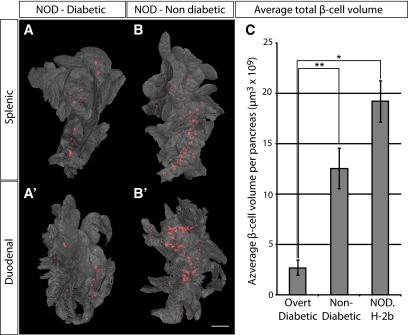
FIG. 5.
Comparison of overt diabetic and nondiabetic NOD sibling pairs. A and B′: Isosurface rendered OPT images of representative diabetic (A and A′) and nondiabetic (B and B′) splenic (A and B) and duodenal (A′ and B′) pancreata labeled for insulin (red). The pancreas outline (gray) is based on the signal from tissue autoflourescense. C: Graph showing the average total β-cell volume in overt diabetic and nondiabetic NOD sibling pairs (n = 5 for each group, pairs analyzed at 14, 14, 18, 18, and 23 weeks) and in NOD.H 2b mice at 16 weeks (n = 3) ± SE. Scale bar is 2.2 mm in A′ and 2 mm in A, B, and B′. Significance levels are indicated, *P < 0.05; **P < 0.01. (A high-quality color representation of this figure is available in the online issue.)

