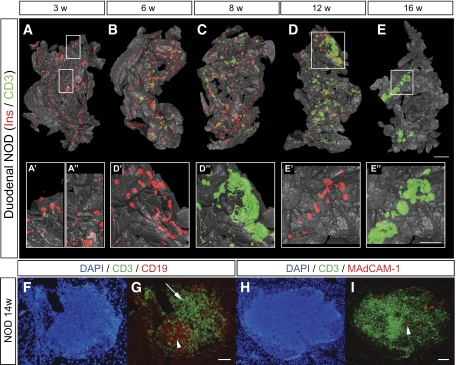
FIG. 6.
Spatial assessment of the progression of autoimmune insulitis in the NOD mouse. A–E: Isosurface rendered OPT images of representative pancreata (duodenal) from NOD mice at 3, 6, 8, 12, and 16 weeks. Ins+ islets (red) are reconstructed based on the signal from insulin-specific antibodies and infiltrating T-cells (green) based on the signal from CD3-specific antibodies. A′–E′′, insets: High-magnification views corresponding to the enclosed boxes in A, D, and E, respectively. n = 3 for 3, 6, 8, and 12 weeks; n = 5 for 16 weeks. Ins, insulin. F and G: Sections of a pancreata from a 14-week-old female NOD mouse stained with DAPI, anti-CD3 (green), and anti-CD19 (red) (F) or anti-CD3 (green) and anti-MAdCAM-1 (red) (G). F: B-cell areas (arrow head) and T-cell areas (arrow) are indicated by arrow head. G: High endothelial venules (arrow head). The scale bar in E corresponds to 2 mm in E, 1.5 mm in C, 1.4 mm in B, 1.3 mm in D, and 1.0 mm in A. The scale bar in E″ corresponds to 1 mm in E″, E′, D″, D′, and 0.76 mm in A″, A′. Scale bar in G corresponds to 100 μm in F and G. Scale bar in I corresponds to 100 μm in H and I. (A high-quality color representation of this figure is available in the online issue.)

