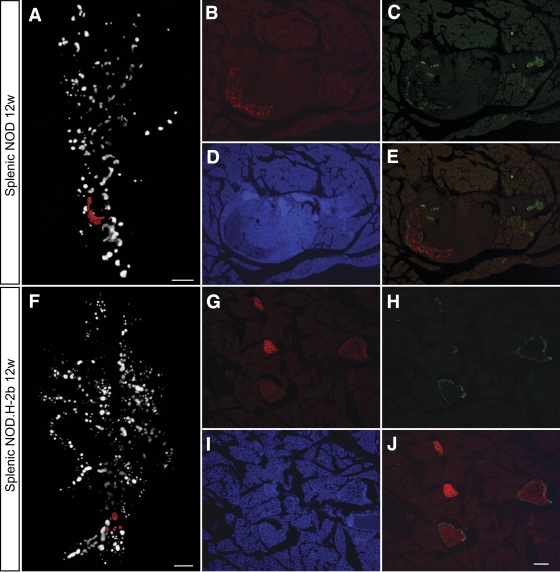
FIG. 7.
Comparision of α- and β-cell distribution in 12w NOD and NODH2b mice. A: and F: Volume renderings of β-cell distribution. Cryosections in B–E and G–J correspond to red pseudocolor in A and F, respectively. Sections were counterstained against glucagon (C, E, H, and J) and DAPI (D and I). Note the remaining Glu+ cells in the highly infiltrated NOD islets (C and E). B and G: Ins+ β-cells. Scale bar in A and F corresponds to 1 mm. Scale bar in J corresponds to 100 μm in B–E and G–J. (A high quality color representation of this figure is available in the online issue.)

