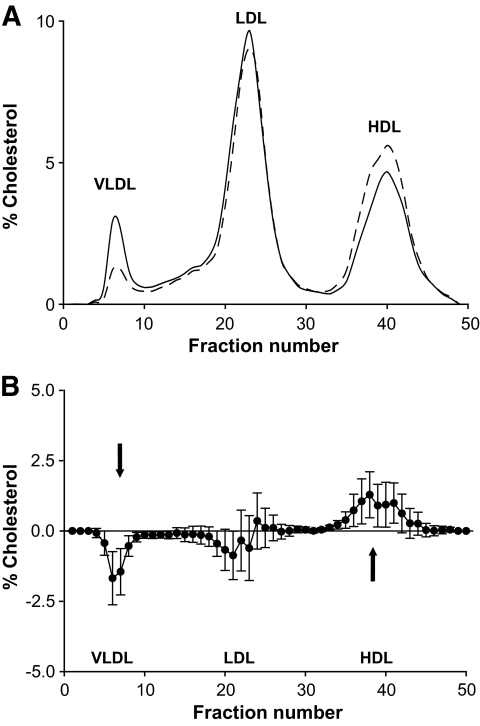
FIG. 2.
A: Means of FPLC lipoprotein cholesterol distribution in subjects with type 1 diabetes (hatched line) and nondiabetic control subjects (solid line). B: Differences in FPLC lipoprotein distribution by type 1 diabetes status (type 1 − nondiabetic, so that a mean above the zero indicates more cholesterol in type 1 diabetic subjects and a mean below the zero line indicates less). Arrows indicate fractions in which statistically significant differences exist.

