FIG. 1.
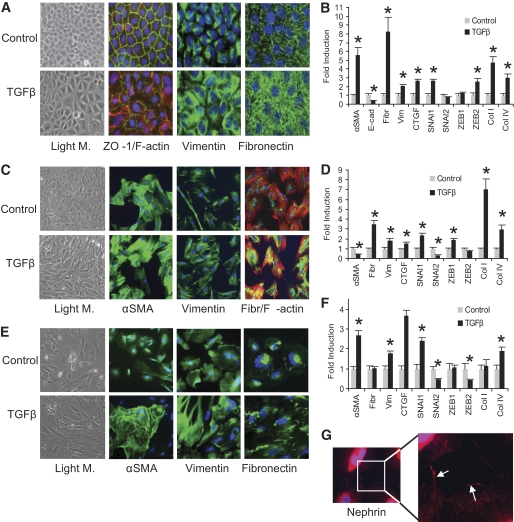
TGF-β induced changes in renal cell morphology, protein, and gene expression. A: NRK52E cells (DMEM, 25 mmol/l glucose, 2% serum), were treated with TGF-β (10 ng/ml, 3 days). Light microscopy (Light M.) images (×20) demonstrate that TGF-β causes a loss of the typical epithelial morphology to larger and more irregularly-shaped cells typical of the myofibroblast phenotype. TGF-β treatment also caused a dramatic decrease of ZO-1 expression at tight junctions between neighboring cells (green) accompanied with increased F-actin expression (red) (×40). Nuclei were stained with DAPI. Expression of vimentin and fibronectin protein was also dramatically increased with TGF-β treatment (green). B: The expression of several genes was assessed by real-time quantitative PCR in NRK52E cells and the significant changes caused by TGF-β treatment are indicated (*P < 0.05, compared with control). C: Rat mesangial cells (DMEM, 2% serum) were treated with TGF-β (10 ng/ml, 3 days). Changes in morphology are evident by light microscopy (×20) with cells adopting a more spindly appearance after TGFβ treatment. Immunostaining for α-SMA expression was increased with TGF-β, as were vimentin and fibronectin (green). A change in F-actin arrangement (red) was more obvious after TGF-β treatment. D: The expression of a number of genes was assessed by real-time quantitative PCR and significant changes in response to TGF-β are indicated (*P < 0.05, compared with control). E: Human podocytes were seeded (33°C) and subsequently differentiated (37.8°C, 10–14 days), followed by treatment with TGF-β (10 ng/ml, 3 days, RPMI with 2% serum). Light microscopy (×20) reveals a dramatic change in phenotype with loss of the typical arborized morphology in control cells, becoming hypertrophic, elongated, and in close proximity with neighboring cells after TGF-β treatment. Immunostaining of podocytes revealed increased α-SMA (green) with TGF-β treatment. Vimentin staining (green) was also increased and altered with rearrangement from fine fibers radiating from the nucleus to the periphery to very strong staining and thicker fibers with TGF-β. Fibronectin was also significantly increased (green) from being mainly associated with the nucleus to a more patchy cytoplasmic localization after treatment with TGF-β. All error bars represent ± SEM. F: Gene expression analysis by real-time quantitative PCR revealed significant changes after treatment with TGF-β as indicated (*P < 0.05, compared with control). G: Mature and differentiated podocytes were characterized by punctuated nephrin expression (red) at the periphery of untreated cells as distinct spots, confirming the identity of these cells as podocytes (enlarged inset).

