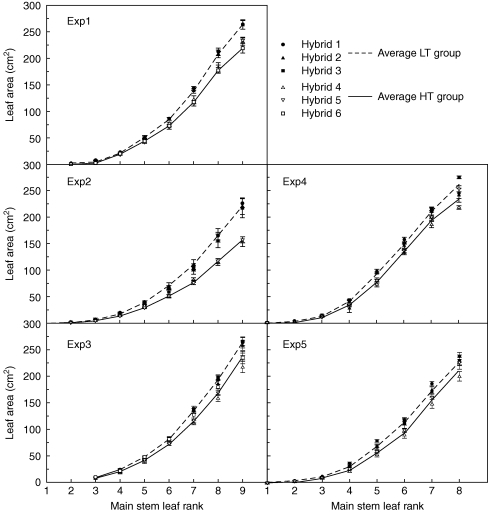
Fig. 3.
Individual leaf size profiles (from L1 to L9) for main shoot (MS) of low-tillering (LT) and high-tillering (HT) hybrids in field (expts 1–3) and controlled environments (expts 4 and 5) experiments. The dotted line represents the average of LT hybrids, the solid line the average of HT hybrids. Vertical bars indicate s.e.m.

