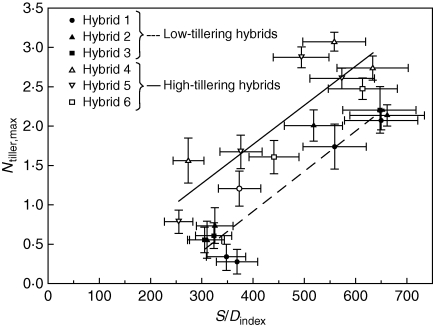
Fig. 6.
Ntiller,max versus S/Dindex for all hybrids and experiments. The S/Dindex incorporates genotypic difference in main shoot leaf size (LWIR) in the plant demand component (see text). The solid line represents linear regression for HT hybrids [y = 0·0050(±0·0001)x – 0·22, R2 = 0·75**] and dashed line represents regression for LT hybrids [y = 0·0051(±0·0001)x – 1·12, R2 = 0·89**]. Results for expt 4 were excluded due to the effect of calcium deficiency on leaf width.

