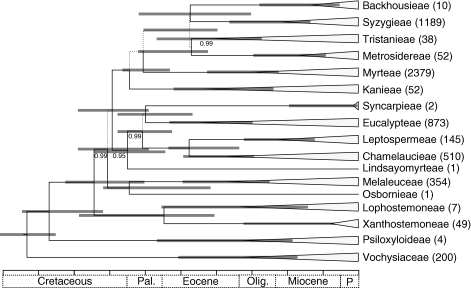
Fig. 4.
Consensus topology of 300 trees obtained from the BRC analyses (see Fig. 2) and pruned to represent tribal diversity in Myrtaceae. Diversity per tribe according to Govaerts et al. (2008) is indicated adjacent to the terminal. Clade support is as in Fig. 1. Vertical bars represent the range of divergence times obtained from the 300 sampled topologies for all nodes receiving a PP ≥ 0·5. Each division in the scale bar is equal to 10 million years.

