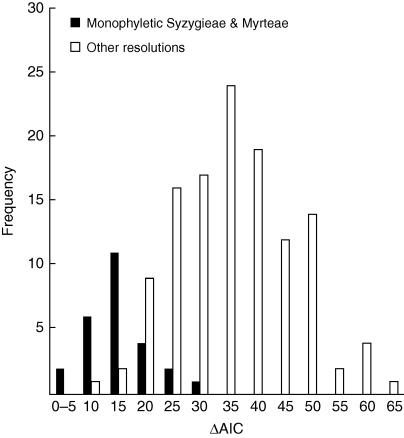
Fig. 5.
Frequency distribution of AIC differences obtained by subtracting the AIC score for the ML shift point estimated under a flexible-rate diversification model on each of 300 sampled topologies (see Fig. 4) with the best AIC score from the overall sample. The black columns represent the ΔAIC for sampled topologies that resolve monophyletic Syzygieae and Myrteae while the white columns represent the ΔAIC for all other resolutions (see Table 2).

