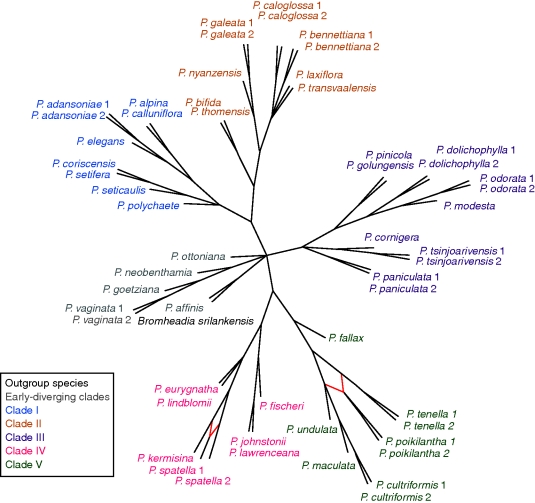
Fig. 4.
Unrooted consensus galled network (20 % threshold for network construction) summarizing incongruities between the five individual gene trees of diploid species using 50 % bootstrap consensus trees as input. Branch lengths are not to scale; only the topology is shown. Red lines represent reticulations. Species names are coloured according to their correspondence to the main clades identified by plastid DNA analysis: clades I–V and species-poor, early diverging clades (Russell et al., 2010).

