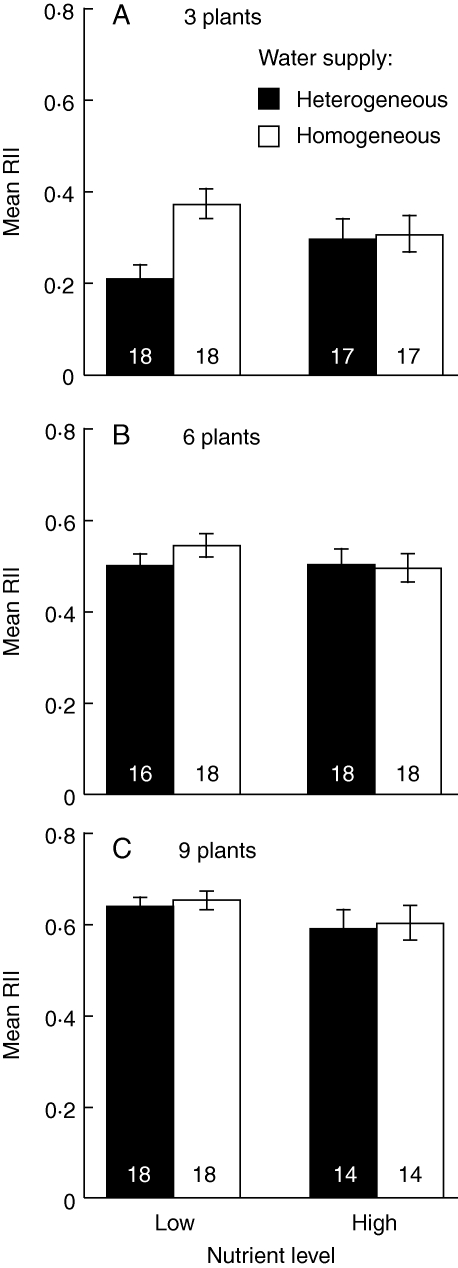
Fig. 5.
Mean relative interaction index (RII, no units; ±s.e.) at the treatment combination of water heterogeneity (homogeneous and heterogeneous supply, as indicated) and nutrient level (Low and High) at each plant density. Numbers inside each column give the sample size for each treatment combination.

