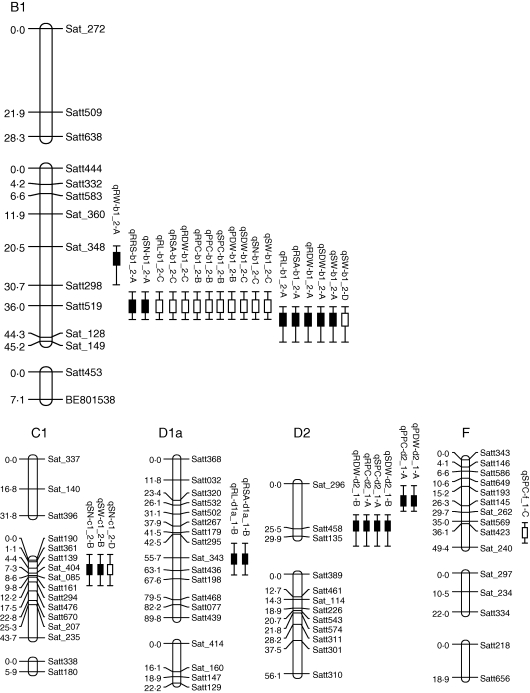
Fig. 4.
Five linkage groups harbouring 31 putative QTLs for root traits as related to P efficiency in an RIL population under low and high P conditions in field trails. The designation on the right is the marker name, and that on the left is the Kosambi function. The box delineates the position of the QTL having the highest LOD value, and the whiskers of each box delineate the QTL support interval. The solid and open boxes represent the QTLs identified at low and high P, respectively.

