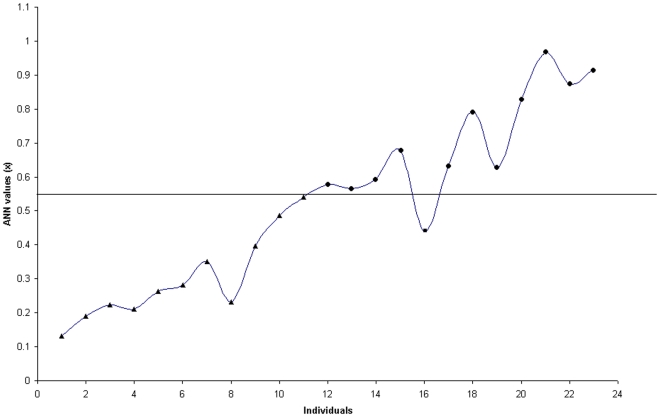
Figure 4. Neural network predication.
Neural network classification of 23 individuals (x-axis) with known clinical information. Values (y-axis) are predicted over the trained network and are 0.1 to 1; values (x) ≤0.54 reflect a neural-network classification of “normal,” and values (x) ≥0.55 reflect a neural-network classification of PD. Individuals denoted by a triangle = normal, circle = PD and square = misdiagnosed individual.

