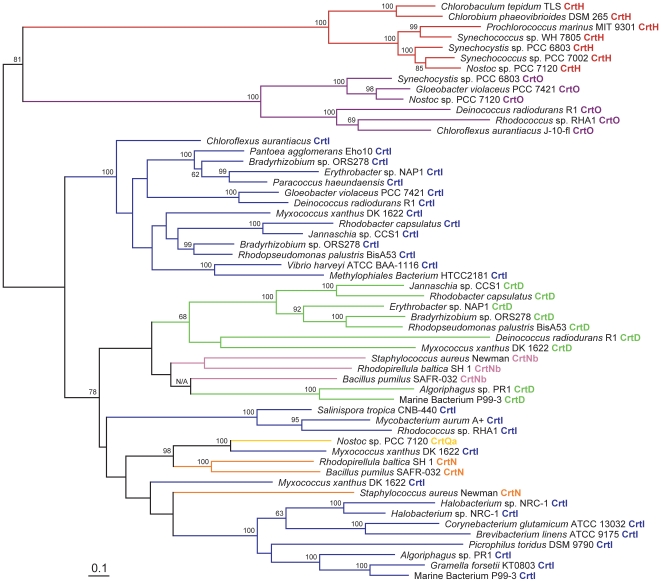
Figure 4. Phylogenetic tree of representative CrtD, CrtH, CrtI, CrtN, CrtNb, CrtO and CrtQa protein sequences constructed using RAxML.
Protein types are color-coded and indicated to the right of the sequence name. Bootstrap values ≥60% are indicated as a percentage of the automatically determined number of replicates determined using the CIPRES web portal. The scale bar represents 10% sequence divergence. The tree is rooted to its midpoint to maximize the clarity of intraclade relationships.

