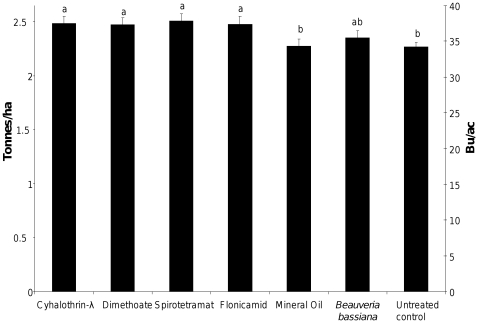
Figure 2. Least-square mean soybean yield in fields treated with six insecticides, 2009.
Data were subjected to a mixed model ANOVA with block, site, treatment incorporated into the model. Observed yields marked by the same letter are not significantly different at α = 0.05 (LSD). Data from 2008 were excluded from analysis because of low overall aphid populations.

