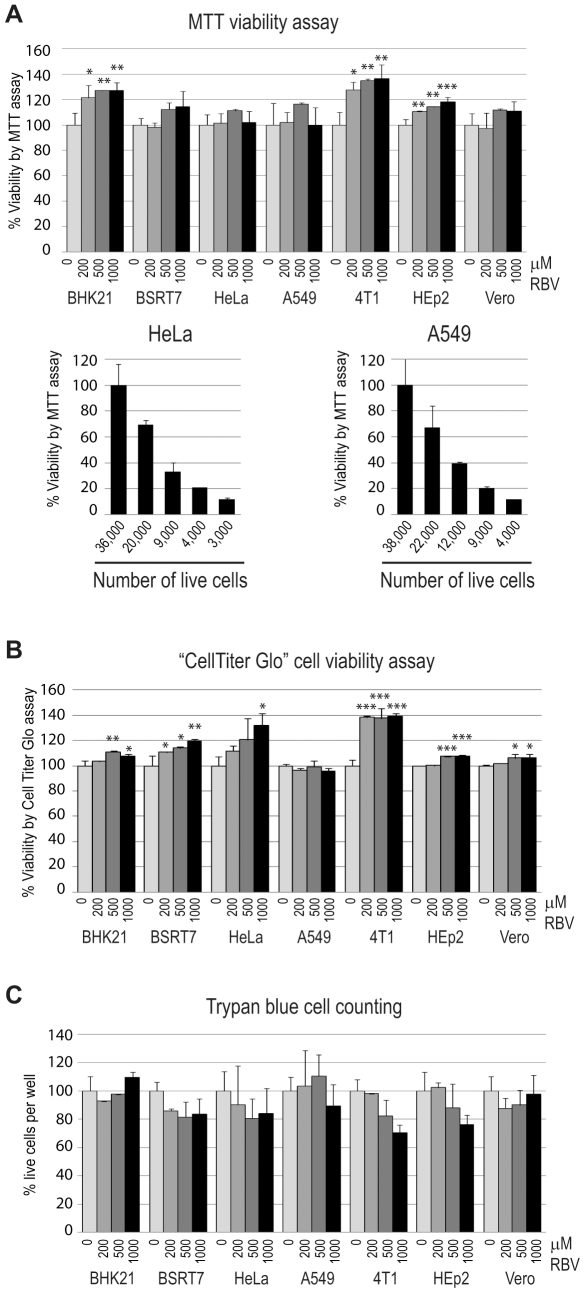
Figure 2. Effect of RBV on cell viability of seven cell lines.
To determine the relative toxicity of increasing concentrations of RBV in different cell lines, 80%-confluent uninfected cells were treated with RBV for 24 h and tested for viability using MTT cell viability assay (A) or CellTiter-Glo Luminescent Cell Viability Assay (B) or by cell counting using trypan blue dye exclusion as an indicator of live cells (C) as described in Materials and Methods. To determine the sensitivity of the MTT assay, serial dilutions of A549 and HeLa cells were plated [lower left and right graphs in (A)], grown for 24 h, cells from separate wells were trypsinized and counted using a hemocytometer (36,000 cells for HeLa and 38,000 cells for A549 formed 100% confluent monolayers), and MTT assay was conducted as described in Materials and Methods. (A–C) The data (done in triplicate) represent the mean ± standard deviation and are expressed as a percentage of the untreated control. Statistical analysis was done using one-way ANOVA with Tukey's post hoc test (GraphPad Prism 4, San Diego, CA). ***P<0.001, **P<0.01, *P<0.05, as compared to mock-treated cells (indicated as 0 µM RBV).

