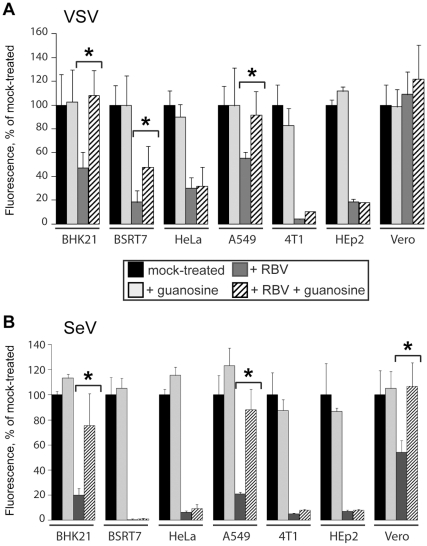
Figure 5. Effect of exogenously added guanosine on antiviral activity of RBV.
Cells were mock infected or infected with either VSV-GFP or SeV-GFP at MOI of 3 CIU/cell, and then mock-treated or treated with SFM containing 500 µM RBV, 50 µM guanosine, or both. The intensity of GFP fluorescent signal at 18 h p.i for VSV (A) and 24 h p.i for SeV (B) was quantified using a 96-well plate reader, as described in Materials and Methods. Each of these experiments was performed twice (done in triplicates) and data points represent the mean ± standard deviation. (A–B) Statistical analysis was done using one-way ANOVA with Tukey's post hoc test (GraphPad Prism 4, San Diego, CA). ***P<0.001, **P<0.01, *P<0.05 are shown to compare RBV plus guanosine treatment against RBV treatment only.

