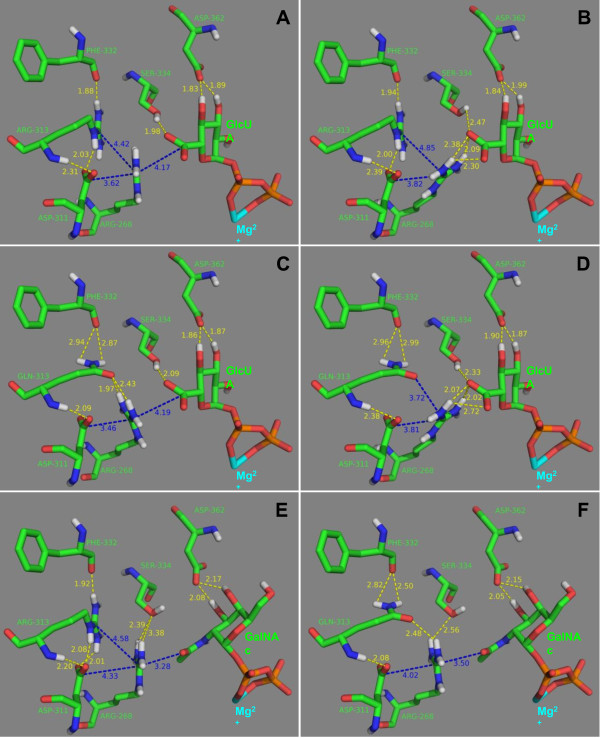
Figure 4.
Docking analysis. Model complexes UDP-GlcUA/K4CP with Arg-268 in the bent (A) and the extended (B) conformation, UDP-GlcUA/(R313Q)-K4CP with Arg-268 in the bent (C) and the extended (D) conformation, UDP-GalNAc/K4CP (E), and UDP-GalNAc/(R313Q)-K4CP (F). Carbon atoms are colored green, nitrogen atoms blue, oxygen atoms red, phosphorus atoms orange, magnesium ion cyan and hydrogen atoms white. For clarity, only polar hydrogen atoms are shown. H-bonds are shown as yellow dashed lines, whereas other distances are shown as blue dashed lines. Distances are in Å.

