
Figure 1.
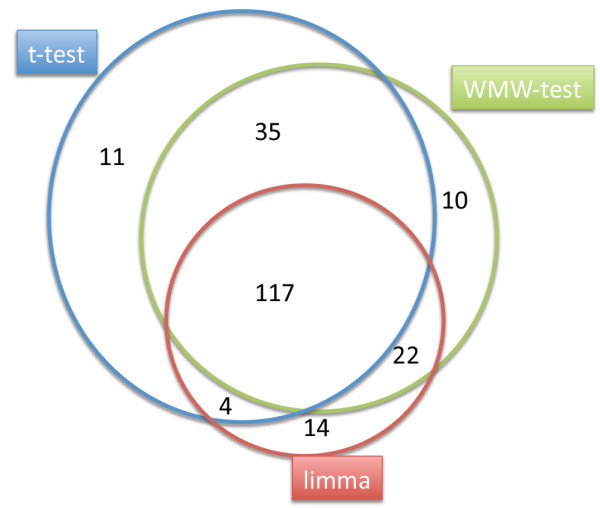
Venn-diagram for the comparison of three hypothesis tests. Numbers of miRNAs that are differentially expressed in blood cells of melanoma patients as compared to healthy controls. The three-way venn-diagram indicates the numbers of miRNA identified as significant by t-test (blue circle), Wilcoxon Mann-Whitney test (green circle), and a linear model with p-values computed by an empirical bayes approach (limma, red circle). The numbers inside the intersections of circles denotes the number of miRNAs significant for two or three of the tests.