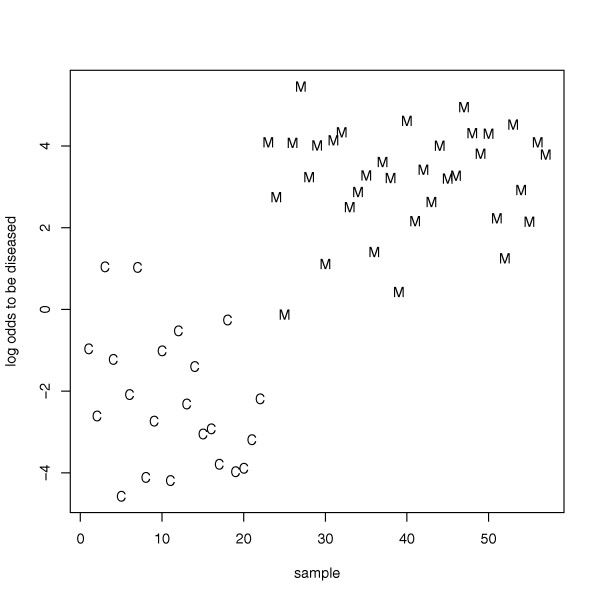
Figure 6.
Classification example. Example for the classification of melanoma patients and healthy individuals based on the miRNA expression profiling of blood cells for the 16 miRNAs as detected by the subset selection. The logarithm of the quotient of the probability to be a melanoma patient and the probability to be a healthy individual is given on the y-axis for each control (C) and each melanoma (M). If this quotient is greater than one e.g. the logarithm is greater zero the sample is more likely to be a melanoma sample than a control sample.

