Figure 2.

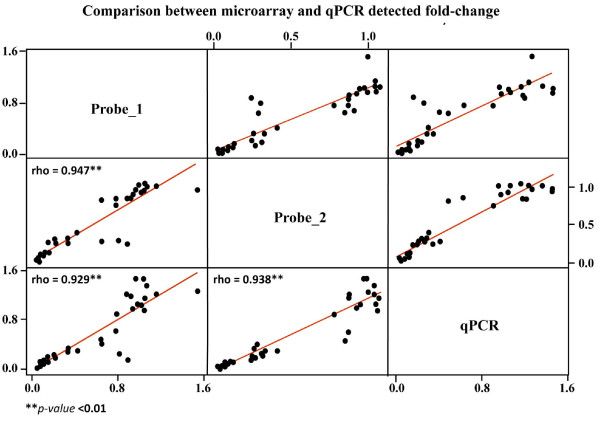
Comparison between microarray and qPCR results. Expression values for the 13 target genes were compared between microarray probes and Real-time RT-PCR data. In X and Y axis are reported microarray- and qPCR-estimated fold changes.

Comparison between microarray and qPCR results. Expression values for the 13 target genes were compared between microarray probes and Real-time RT-PCR data. In X and Y axis are reported microarray- and qPCR-estimated fold changes.