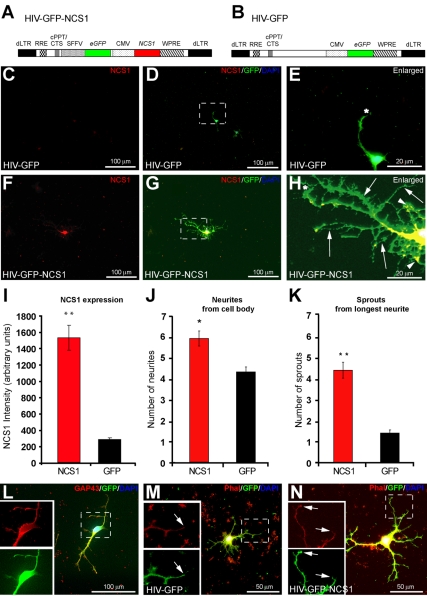
Figure 1. NCS1 overexpression promotes neurite sprouting in vitro.
(A) Schematic vector map illustrating the HIV-GFP-NCS1 vector showing eGFP and NCS1 gene driven by the SFFV and CMV promoter, respectively. (B) The control HIV-GFP vector contains only the eGFP gene driven by the CMV promoter. The lentiviral vector also contains: a self-inactivating 5′-deleted LTR (dLTR), a woodchuck hepatitis virus post-transcriptional regulatory element (WPRE), a central polypurine tract-central termination sequence (cPPT/CTS), and Rev response elements (RRE). (C–E) Primary culture of adult cortical neurons transduced with control vector HIV-GFP at a multiplicity of infection (MOI) of 10 showing low levels of NCS1 and limited neurite sprouting after 3 d in vitro (NCS1, red; GFP, green; DAPI, blue; longest neurite, *). (F–H) Transduction with HIV-GFP-NCS1 at a MOI of 10 induces extensive neurite sprouts from cell body and longest neurite (NCS1, red; GFP, green; DAPI, blue; longest neurite, *; neurites from cell body, arrowheads; sprouts from longest neurite, arrows). Panels E and H are higher power images of dashed boxes in panels D and G, respectively. (I) Significant elevated NCS1 levels were present in NCS1-transduced neurons compared to the controls. (J–K) A significant increase in neurite sprouting from both the cell bodies and longest neurites in NCS1- (red bar) compared with GFP- (black bar) transduced neurons was observed. (L) Dual immunolabelling of GFP positive (green) and the neuronal growth associated marker (GAP43) (red) in transduced neurons indicating cortical neurons. (M–N) Dual labelling of phalloidin staining (red) coexpressing with GFP immunostaining (green) indicates GFP driven by either SFFV or CMV promoter is a sufficient marker to distinguish neurites (arrows) from both NCS1- and control-transduced neurons, respectively. Data are expressed as mean ± SEM from n = 3 independent experiments. * p<0.05, ** p<0.01, Student's t test. Scale bars: (C,D,F,G,L) 100 µm, (M,N) 50 µm, and (E,H) 20 µm.

