Figure 1.

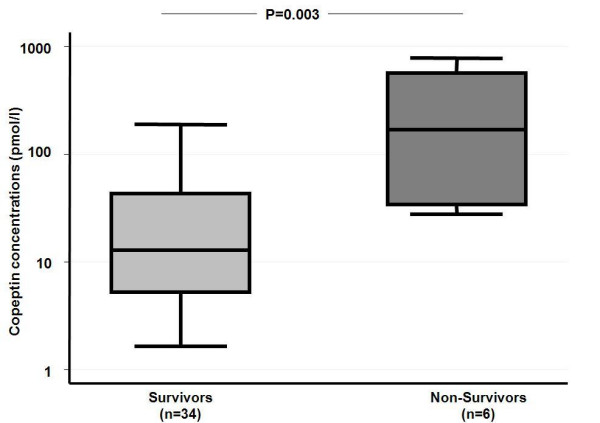
Baseline log copeptin levels in patients who died or survived after ICH. A box encloses the middle 50 percent, where the median is represented as a horizontal line inside the box.

Baseline log copeptin levels in patients who died or survived after ICH. A box encloses the middle 50 percent, where the median is represented as a horizontal line inside the box.