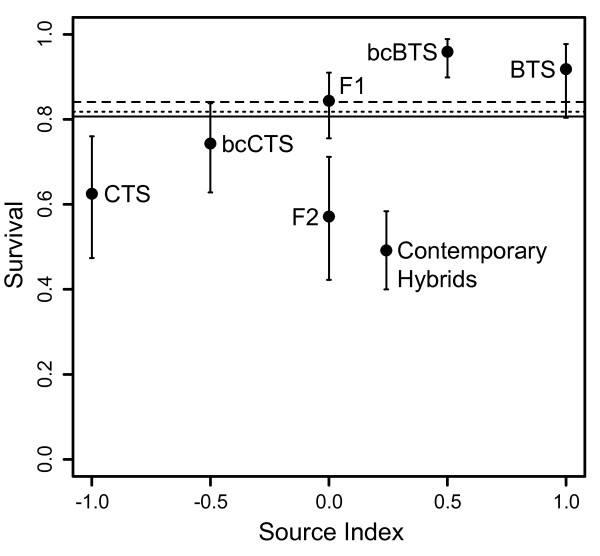
Figure 1.
Comparison of line - cross means to weighted expected mean survival in the 0th (solid line), 1st (dashed line), and 2nd (dotted line) generations of admixture (± 95% CI). The 'Source Index' (θS) = 2P - 1, where P is the average frequency of introduced BTS alleles in each cross type (Lynch 1991).

