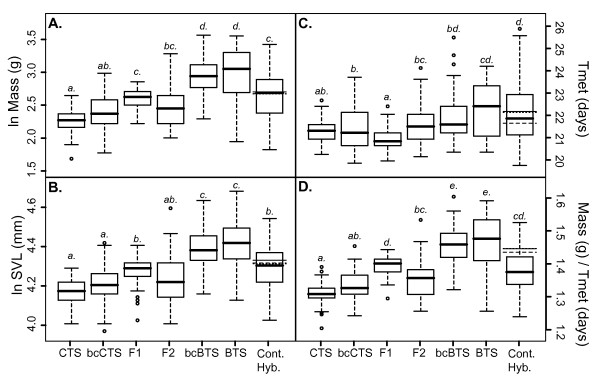
Figure 2.
Box-and-whisker plots of phenotypic trait values for A) Mass, B) SVL, C) Tmet, & D) Growth. Mass and SVL have been log-transformed and Tmet and Growth have been square-root-transformed. Letters above each line cross denote significant differences at α = 0.05 based on multiple t-test comparisons with Bonferroni correction. Horizontal lines denote the expected mean phenotypes for contemporary hybrids in the 0th (solid line segment), 1st (dashed line segment), and 2nd (dotted line segment) generations of admixture. The abbreviation 'Cont. Hyb.' stands for 'Contemporary Hybrids'.

