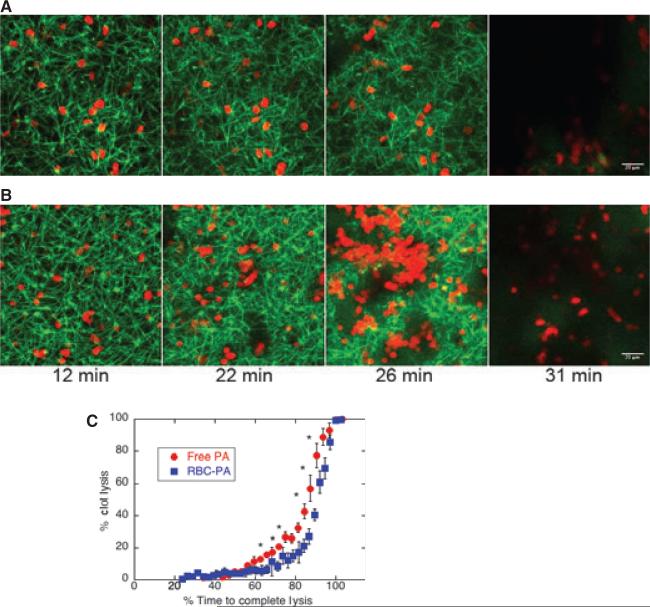
Fig. 3.
Lysis by red blood cell-plasminogen activator (RBC-PA) differs quantitatively from lysis by free PA. Lysis catalyzed by free PA (0.00902 μM, final conc) + 2% hRBCs (A) or 2% RBC-PA (B) visualized by confocal microscopy. In these particular images, representative of 10 free PA and six RBC-PA experiments, both networks achieved dissolution at 31 min. (C) A plot of average % clot lysis vs. a relative scale of % time to complete network dissolution. Error bars are standard error of the mean. *P < 0.05 for comparison of RBC-PA with free PA (independent t-test; n = 6 for RBC-PA and n =10 for free PA).

