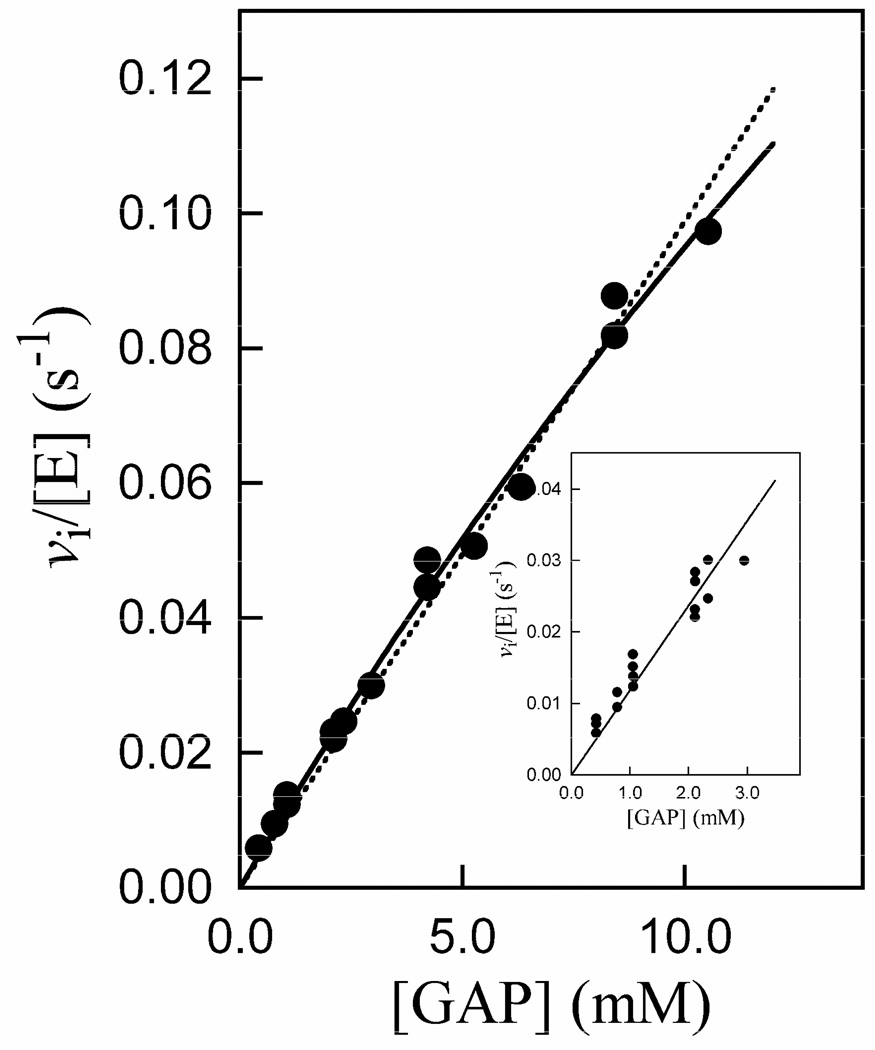
Figure 4.
Michaelis-Menten plot of initial velocity data for the isomerization of GAP catalyzed by K12G TIM at pH 7.5 (30 mM TEA), 25 °C and I = 0.10 (NaCl). The solid line is the fit of the data to the Michaelis-Menten equation, and the dashed line is the linear relationship for the case [GAP] ≪ Km. The inset shows the linear correlation of the data for [GAP] ≤ 3 mM, the slope of which gives kcat/Km = 12 M−1 s−1.

