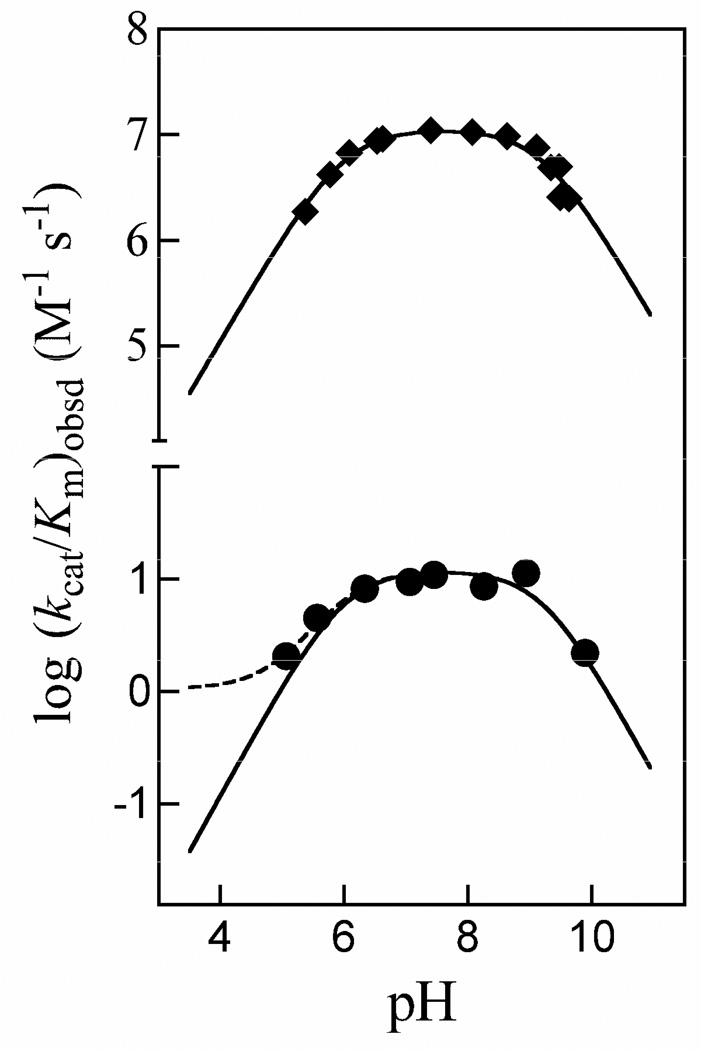
Figure 6.
The pH dependence of the observed second-order rate constant (kcat/Km)obsd for the isomerization of GAP catalyzed by wildtype and K12G TIM. (◆) Data of Plaut & Knowles for wildtype TIM from chicken muscle at 30 °C (35). The solid line shows the fit of the data to eq 8 with (kcat/Km)* = 0. (●) Data from this work for K12G mutant yeast TIM at 25 °C. The solid and dashed lines compare the nonlinear least squares fits of these data to eq 8 using values of (kcat/Km)* = 0 and 1.1 M−1 s−1 for turnover of GAP monoanion, respectively (Scheme 3).

