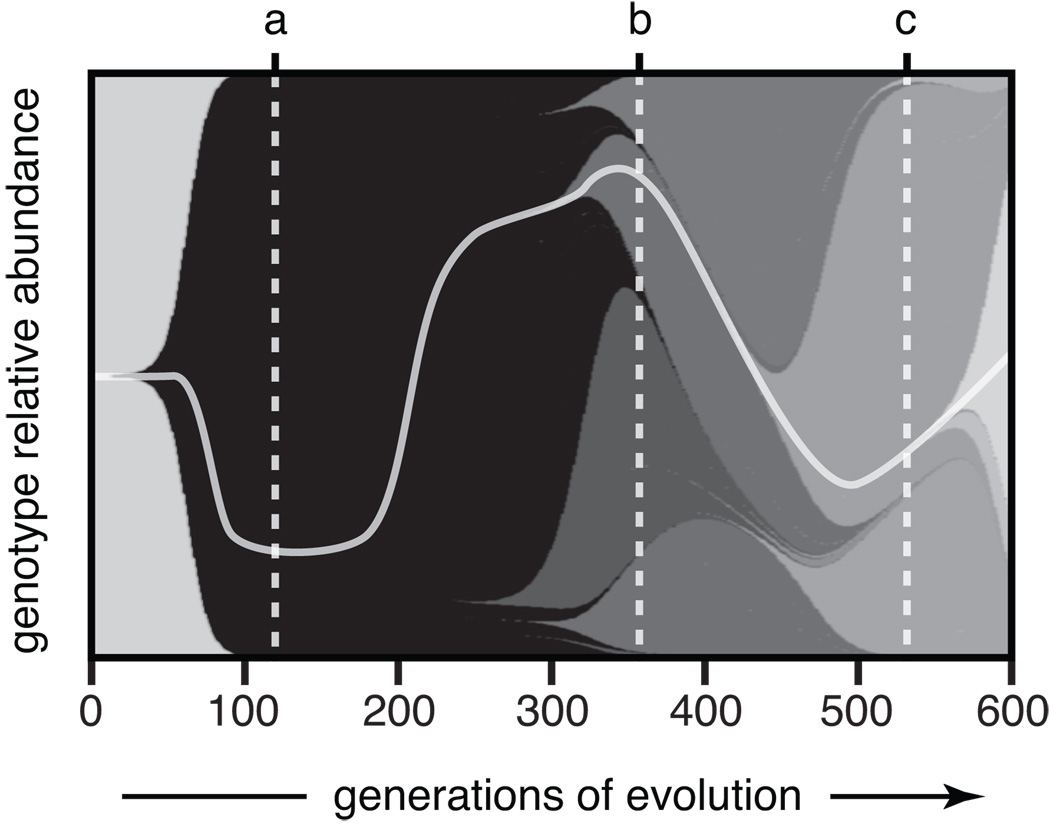
Figure 1. Expected dynamics in an evolving bacterial population.
Lineages with new beneficial mutations are depicted as shaded wedges that originate in a previous genetic background and rise in frequency as they outcompete their ancestor and other lineages (Muller 1932). The same shading indicates lineages have equivalent fitnesses, and the path to the final dominant genotype containing five mutations is highlighted by the light gray curve. This figure was produced using a simulation with population size and mutation parameters meant to model the first 600 generations of the E. coli long-term evolution experiment (Woods 2005). Notice how the level of genetic diversity changes over time. Early on, a new beneficial mutation sweeps to fixation and the population has little diversity (a). Later, four lineages with different mutations coexist at appreciable frequencies for a time (b) before the descendants of one lineage become a majority (c).

