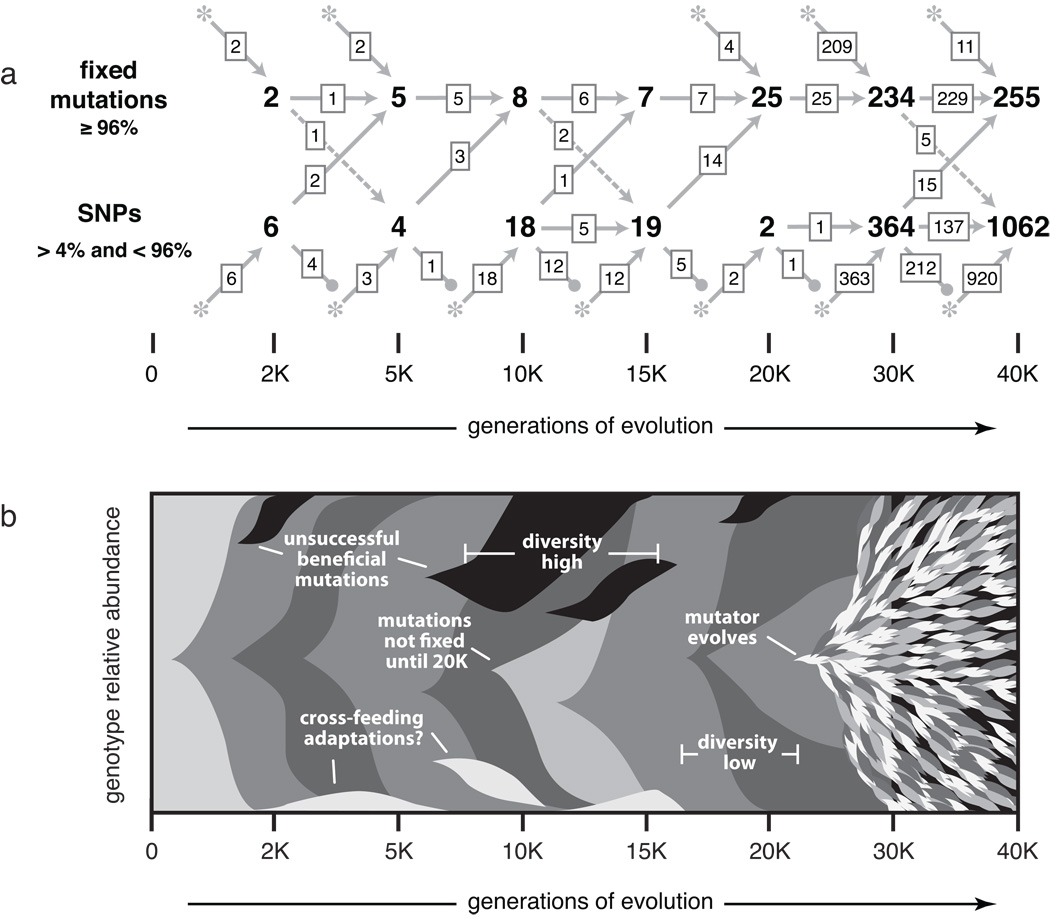
Figure 5. Mutational diversity in an evolving E. coli population.
(a) Origin and eventual fate of point mutations in the 2K to 40K mixed-population samples. New mutations that first appear as SNPs or fixed alleles are shown as asterisks along the bottom or top, respectively, with arrows leading to the corresponding pools of SNPs and fixed mutations. Transient SNPs that were lost from the population are shown by descending lines ending in closed circles. Note that we only detect SNPs when they are between roughly 4% and 96% frequency in the population, and that we only recover approximately 50% of the SNPs at 5% frequency. Only the 49 SNP predictions in Table 2 were included for the 2K to 20K samples. (b) Stylized summary of the mixed-population SNP analysis. Shaded wedges represent subpopulations containing new mutations relative to the previous genetic background. Mutations are grouped to highlight their eventual fates, but we do not always have linkage information to resolve which SNPs occurred together. Labeled features are explained in the text.

