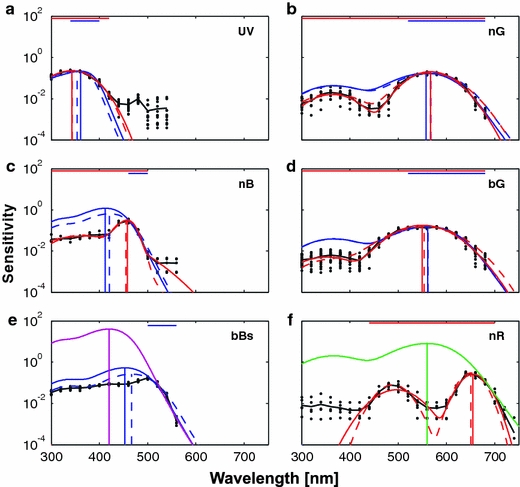
Fig. 5.

Fits to the sensitivity profiles of UV, nB, bBs, nG, bG and nR classes. The measured log sensitivity spectra (black dots; black line shows the average) were fitted with the rhodopsin templates (blue lines) and heuristic asymmetric Gaussian functions (red lines). The fitting was performed both in the logarithmic (solid lines) and in the linear domain (dashed lines). The vertical lines designate the peak wavelengths obtained with different fits. The horizontal bars designate the interval of data used for fitting the template spectra (blue lines) and heuristic fits (red lines). The UV, nB and bBs sensitivity spectra in the left-hand column (a, c, e) yielded predictions for rhodopsins peaking in the UV, violet and blue, respectively (see Table 1). The magenta line in e, showing the template of a rhodopsin peaking at 420 nm, was fitted by eye. In the right-hand column, the nG and the bG spectra (b, d) yielded predictions for a rhodopsin absorbing maximally at 560 nm (see Table 1). The green line in (f), showing this rhodopsin spectrum, was fitted to the sensitivity profile of the nR class by eye. The numerical fitting results for all classes are shown in Tables 1, 2, and 3. Fits to classes V and bBb are not shown. Individual fits to nR and fR classes are shown in Fig. 10 (colour figure online)
