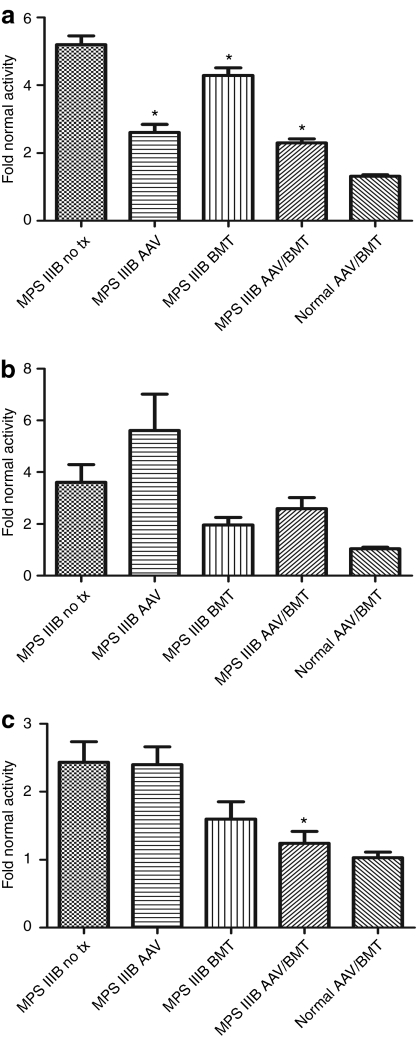
Figure 2.
Tissue β-glucuronidase activity in treated and untreated mice. (a) Brain, (b) liver, and (c) spleen from 4 to 6 animals in each group were homogenized and β-glucuronidase activity was determined. Activity values ± SEM for each MPS IIIB group are graphed relative to the mean of the normal untreated group. Significant differences of treated from untreated MPS IIIB groups are indicated with *P < 0.05. AAV, adeno-associated virus; BMT, bone marrow transplant.

