Figure 4.
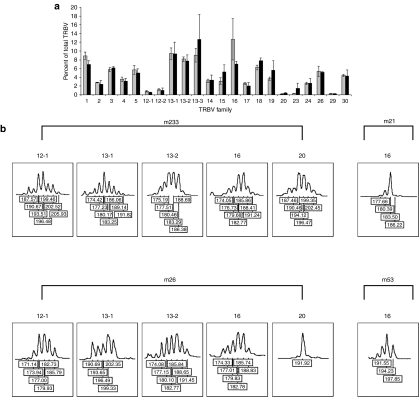
Analysis of T-cell receptor Vβ repertoire and CDR3 spectratyping in splenocytes from mice following lentiviral vector–mediated gene transfer. (a) Splenocytes were isolated from mice between 6 and 18 months post-transplantation, and Vβ repertoire analysis was performed by quantitative RT-PCR. The percentage of each Vβ family is indicated with results representing the mean of triplicate values for each group (n = 3) with error bars representing the SEM. Gray bars, C57Bl/6 control group; black bars, EF1α-γc treatment group. (b) CDR3 spectratypes of TCRVβ 12-1, 13-1, 13-2, 16, and 20 families in reconstituted mice receiving either C57Bl/6 control or IL2RG−/− progenitor cells treated with the EF1α-EGFP or EF1α-γc vectors (m233 and m26, respectively). Normal Gaussian distribution (6–11 peaks each separated by three nucleotides) was observed for TCRVβ 12-1, 13-1, 13-2, 16, and 20 in m223 and TCRVβ 12-1, 13-1, 13-2, and 16 in m26. Restricted CDR3 spectratyping of TCRVβ 16 in m21 (C57Bl/6 control progenitor cells treated with the EF1α-EGFP vector) and TCRVβ 20 in m26 (IL2RG−/− progenitor cells treated with the EF1α-γc vector) was observed. EF1α, elongation factor-1-α TRBV, T-cell receptor Vβ.

