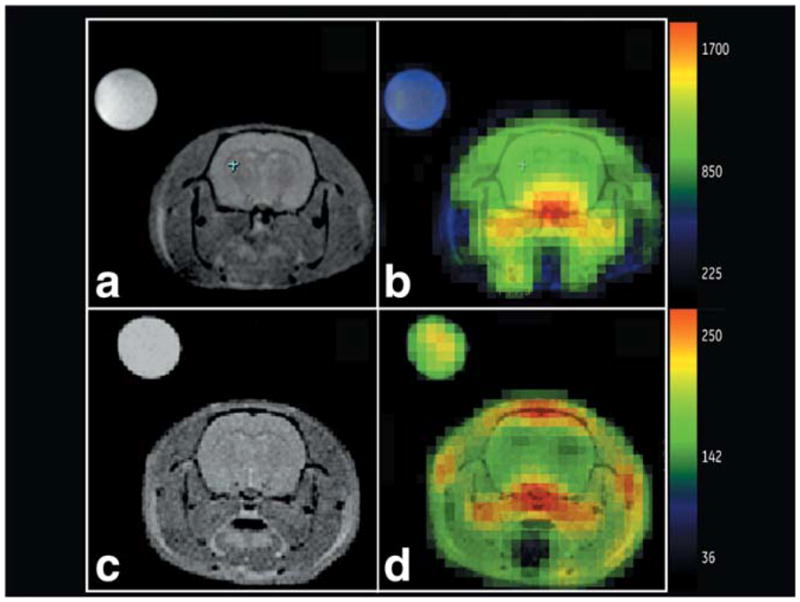
FIG. 1.

3-T Axial T2W proton reference images are shown in (a,c), and the corresponding color [1-13C] pyruvate images overlaid on grayscale proton anatomic images are shown on the right in (b,d). 8-M 13C-urea insert signal is projected across the chemical shift for quantitative reference. Top: 1.06 μmol g−1 dose; image collected starting 20 sec after start of injection (rat H76). Bottom: 1.01 μmol g−1 dose; image collected starting 36 sec after injection (rat H88).
