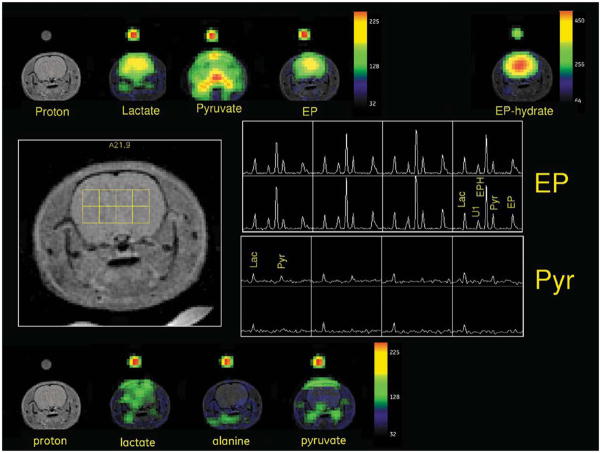
FIG. 4.
Metabolic images of [1-13C]-pyruvate with a 45-sec image delay and [1-13C]-EP with an image delay of 25 sec are compared (rat H91). Metabolite maps from the EP injection are shown at the top, and maps for the pyruvate injection, along the bottom. A phased and baseline-corrected spectral array for a 4 × 2 grid of brain voxels is illustrated in the center, along with the voxel positions on a reference proton image. The top right center panel shows the EP spectral grid and the bottom right center panel shows the [1-13C]-pyruvate results.

