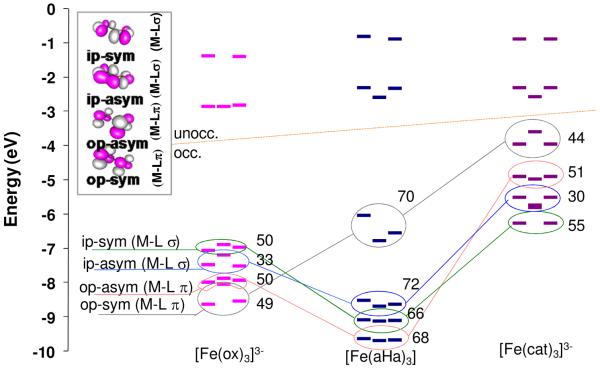
Figure 9.
Comparison of the β spin energy levels in high spin Fe(III) tris oxalate, [Fe(ox)3]3−, Fe(III) tris hydroxamate [Fe(aha)3] and Fe(III) tris catecholate [Fe(cat)3]3−. Numbers indicate the O character in the corresponding orbital of the free ligand (shown in the contours, in inset). Lines join the orbitals in the different manifolds with similar intra ligand bonding.

