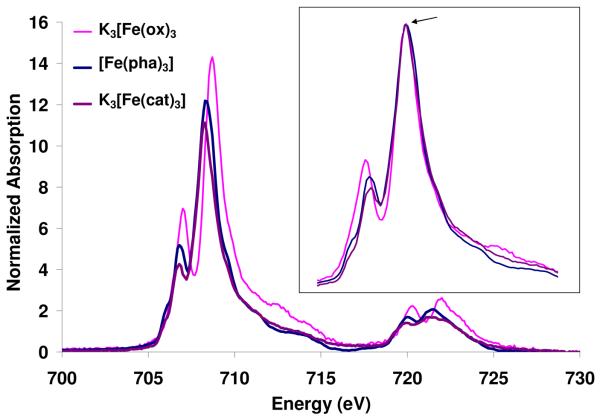
Figure 3.
Normalized Fe L-edge absorption spectra for the compounds: K3[Fe(cat)3], [Fe(pha)3] and K3[Fe(ox)3] (data from reference 16). Inset shows the three spectra shifted in energy to superimpose and scaled to the same intensity on the main peak, arrow.

